Letztes Update: 1. August 2024
Many people use the turn of the year to take a look into the future. What will the stock market year 2024 be like? What do experts expect for stock market prices in 2024? Who will be the new Nvidia? In this article, we take a closer look at how meaningful such forecasts (or rather: glances into the crystal ball) are. And we take a look back at the stock market year 2023. How did the various asset managers perform in 2023? How does your bank compare in terms of performance? Find out with a free performance comparison. Because now is the right time to set the course for 2024.
Forecasts for the stock market year 2024
Every self-respecting bank (and which one isn’t) published its forecasts for 2024 at the end of last year or in January.
The investment experts at Zürcher Kantonalbank assume that the first half of the year will be characterized by fears of recession, which are likely to materialize, and that the second half will be more optimistic.
In its annual outlook, UBS anticipates interest rate cuts and weaker economic growth and suggests that investors should prepare for the coming period of volatility.
For Raiffeisen, the pharmaceutical sector is one of the favorites this year due to the cautious economic scenario. In addition to the defensive characteristics, the long-term structural trends would also speak in favor of pharmaceutical stocks.
Vontobel sees a recession as the baseline scenario and would like to find quality stocks in the portfolio in this case. Vontobel saw the turnaround coming as early as the beginning of 2023, while other banks did not pick up on this term until the beginning of 2024.
Julius Baer expects the first interest rate cuts to take place in the second quarter of this year, heralding the start of a new economic cycle. On the equity side, the private bank would therefore start the year with an exposure to quality growth stocks and defensive stocks. Before the start of the next economic cycle, however, cyclical stocks are likely to come back into focus.
Deutsche Bank does not expect a recession in any of the major economic regions due to the extensive investment programs. It therefore also sees “interesting price potential” in the key regions for 2024. In its equity index forecast of November 15, 2023, Deutsche Bank sees the SMI at 10,700 points and the S&P 500 at 4,700 points at the end of 2024. Based on closing prices at the end of 2023, this would correspond to a fall of around 4% for the SMI and a fall of around 1.5% for the S&P 500. Two and a half months later, the “interesting price potential” is already history.
What the 2023 share year was like
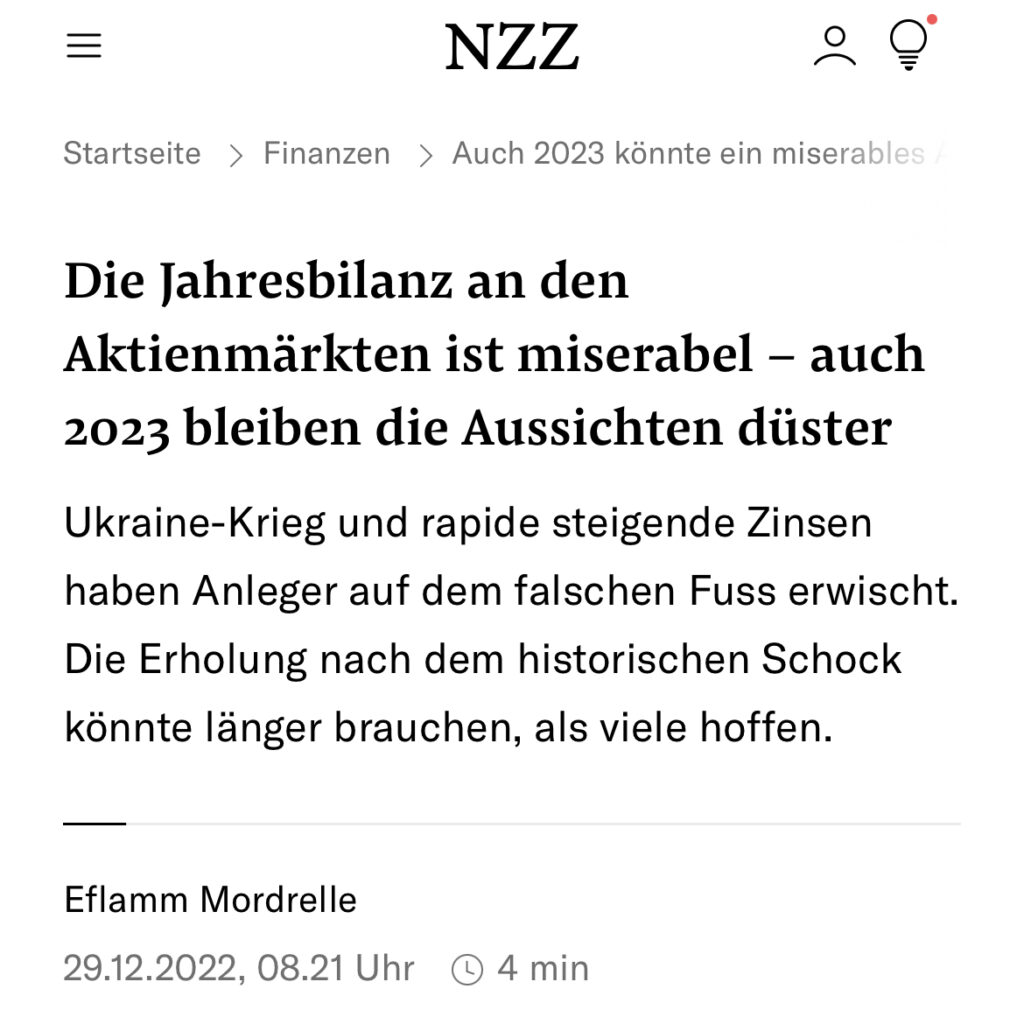
Let’s take a look at the headline of an NZZ newspaper article from December 29, 2022 and see whether the fears expressed therein for the 2023 stock market year have been realized.

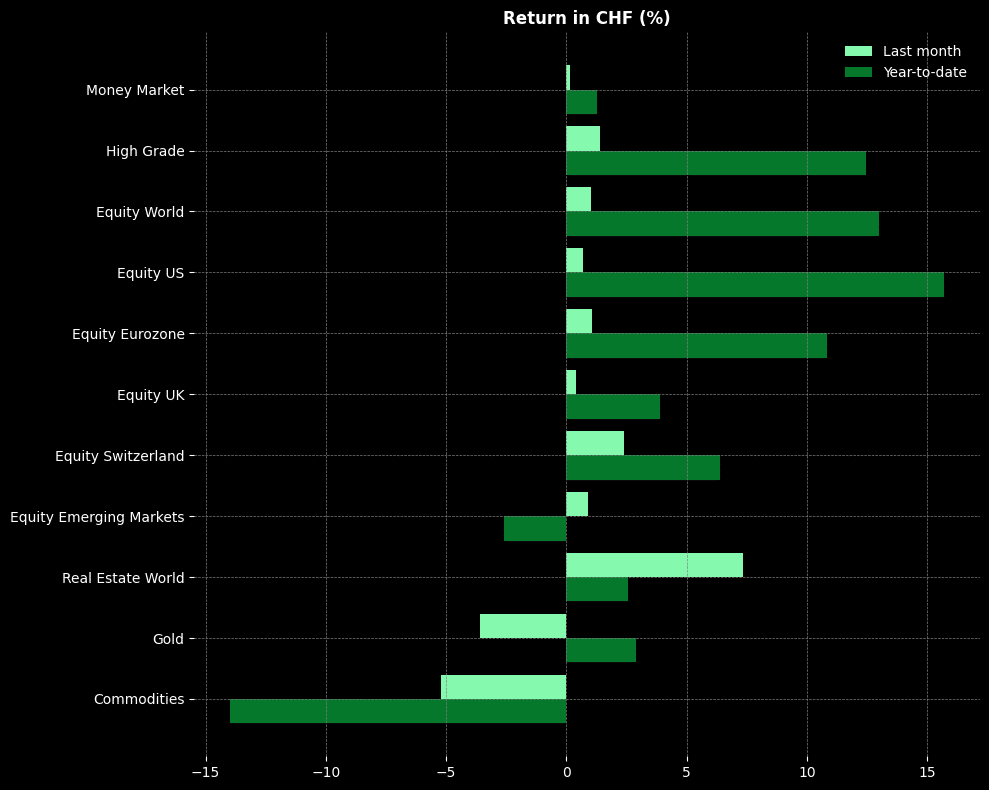
A look at the returns of the asset classes in Swiss francs shows encouraging things – because 2023 was not “gloomy” on most stock markets. Only commodities and the equity markets of emerging countries posted a negative return in 2023.

What will your portfolio look like in 2023? You’ve probably received a statement of assets from your bank in the last few days, with a gray jumble of numbers and a graph with a twitchy line that starts at the bottom left and ends at the top right (or in the middle). But is the performance of your asset manager or bank good or bad? This question is not so easy to answer, partly because most asset statements lack a benchmark. The return was positive, but how did your portfolio compare to other existing portfolios? Find out and order the free performance comparison of your investment portfolio.
Depocheck free of charge Switzerland
After entering your data, you will receive an e-mail with a short personal report. The free performance comparison includes:
- General market comparison
- Your return in comparison
- Rating of your bank/asset manager
The data is based on the analyses of ZWEI Wealth – the largest wealth management ecosystem independent of banks and asset managers. ZWEI Wealth provides investors with significantly increased transparency regarding services, offers and costs.
Portfolio returns in comparison
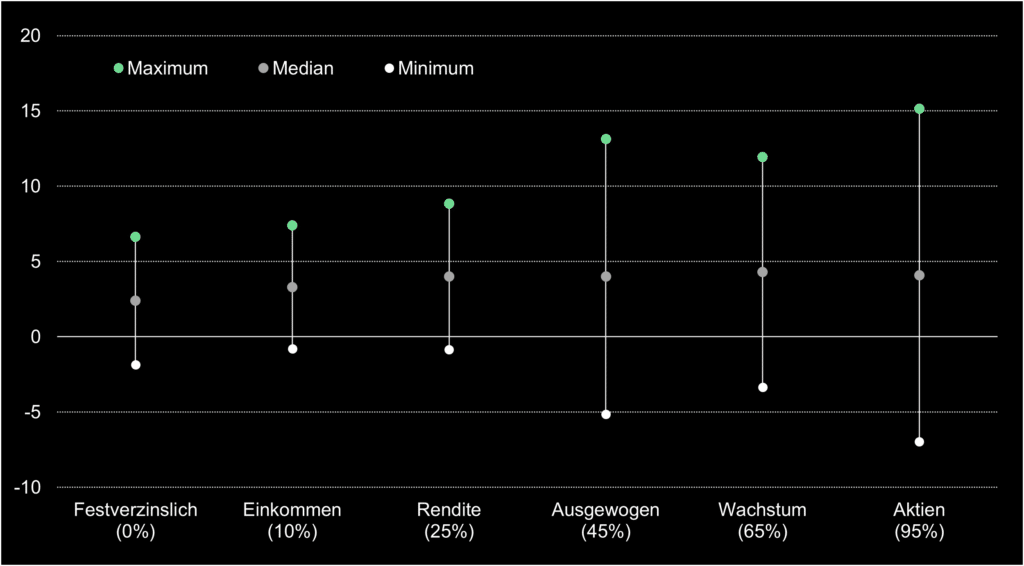
ZWEI Wealth analyzes the performance of several hundred portfolio types on a monthly basis. The return figures generally correspond to a net value in accordance with the GIPS standard. This is how the portfolios analyzed performed in Swiss francs in the period from January 1 to December 31, 2023:
The median return is the average return of all portfolios. This means that 50% of the portfolios achieved a higher and 50% a lower return than the median return. Firstly, it is striking that the median return of all portfolios is positive. And secondly, that the median return of the portfolios is almost the same everywhere from an equity ratio of 25%. Only the fluctuation range of the maximum and minimum returns increases as the proportion of equities rises. The maximum portfolio with an equity share of 95% achieved a return of over 15% and the minimum portfolio a return of around minus 7%.
Analysis instead of forecasts with the independent portfolio check
Instead of focusing on stock bets, possible index levels and promising future topics, you should take a close look at your existing portfolio and carry out a portfolio check your portfolio. Does the portfolio still correspond to my risk profile? Does the portfolio still meet my objectives? What return was achieved at what risk and what were the actual costs? Do I mainly have the bank’s own products in my custody account and can conflicts of interest arise as a result?
FAQ Depotcheck
A custody account check shows your return compared to other existing custody accounts. The performance comparison shows the range between the worst and best performance on the market in 2023. You can also see the median value and the rating of your bank or asset manager.
Yes, the performance comparison is free and non-binding. For more detailed deposit checks, test reports or cost controls, I will be happy to provide you with a quote.
You enter a few personal details and your portfolio data in the online form and a few days later you will receive the performance comparison from me by e-mail.
Transparency and disclaimer
I was not paid by anyone for this blog post, it reflects my subjective opinion.
If you open accounts or business relationships, order products or services through my links and codes, I may receive a commission for doing so. However, you will not suffer any disadvantages such as higher prices or the like. The terms and conditions of the respective providers apply. Affiliate links are marked with a *.
Investments are associated with risks which, in the worst case, can lead to the loss of the capital invested.
All publications, i.e. reports, presentations, notices as well as contributions to blogs on this website (“Publications”) are for information purposes only and do not constitute a trading recommendation with regard to the purchase or sale of securities. The publications merely reflect my opinion. Despite careful research, I do not guarantee the accuracy, completeness and timeliness of the information contained in the publications.

