Letztes Update: 28. September 2023
Another year comes to an end. So it’s time to take a look at the real-money portfolios of four robo-advisors. In addition to the performance achieved in 2021, we also take a closer look at the reporting functions of the individual providers in this annual review. By the way, the robo-advisors are sorted alphabetically.
And what you should always keep in mind when making comparisons: not all returns are the same. This article explains the different types of returns.
If you choose one of the providers, you will find attractive starting conditions for all four robo-advisors under Vouchers.
findependent
News and general
The investment app findependent is the latest robo-advisor presented here. I have only had a securities account there since March 2021. A lot has happened since then: fees have been lowered, they won over several lions on the TV show “Die Höhle der Löwen” and you can now put together your own strategies with pre-selected ETFs.
You can invest in findependent investment solutions from as little as CHF 500. No management or custody fees are charged on the first CHF 2,000. For the assets above, the management and custody fee is 0.44% per year. In addition, the product costs, stamp taxes and exchange rate surcharges are charged. You can find more information in this article.
Portfolio
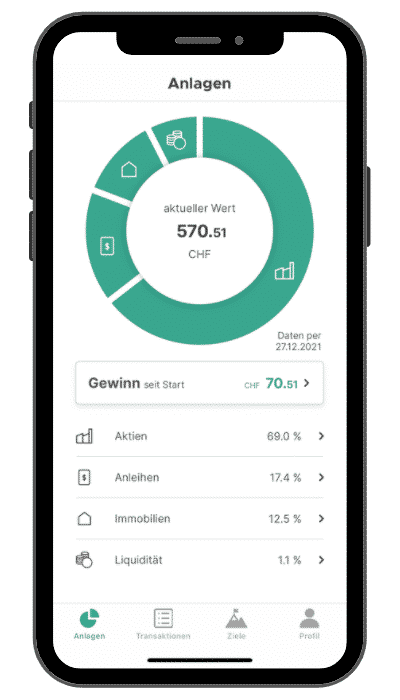
At the time, I opted for the investment solution with the highest share of equities. This was the findependent investment solution “Courageous” with 80% shares. In the meantime, there is also the investment solution “Risky” with 98% shares. I will probably switch to this one soon. At the beginning, I paid in CHF 500 and have not invested further since then.
Because findependent always buys whole ETF shares, the actual weighting differs from the target weighting. A share of the bond ETF, for example, costs just under CHF 100.
Performance
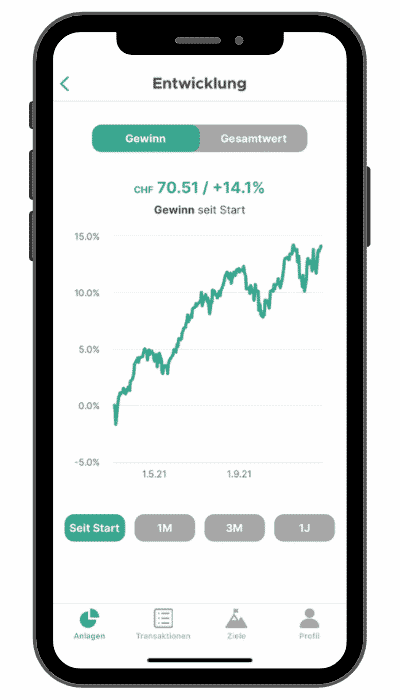
If I show charts here now, then these are to be regarded with caution. Depending on the presentation, the charts look compressed and thus like a wild roller coaster ride, sometimes absolute values are shown, sometimes percentages, etc. I am aware that it is hardly possible to make a comparison with this. But you should get an idea of what it’s like in the apps and web apps so you can find the most suitable provider for you.
The reporting function is not lush, but sufficient to get a rough overview. Since the beginning of 2022, the returns since inception of the individual ETFs can now also be viewed.
Inyova
News and general
After the name change from Yova to Inyova and the expansion to Germany, Inyova’s Pillar 3a was launched in the fall. I have had my custody account in free assets with Inyova since the fall of 2020.
The minimum investment with Inyova is CHF 2’000 once or CHF 500 monthly. The all-inclusive fee starts at 1.2% and decreases to 0.6% as assets increase. Product costs and exchange rate surcharges are not additional. However, stamp duties will be charged. Details about Inyova can be found in this article.
Portfolio
I opted for the strategy with 100% shares, paid in CHF 2,000 at the beginning and have not made any further deposits since then. In total, there are 35 shares in my Inyova portfolio. Nibe Industrier (sustainable energy solutions) is the best performing stock with a gain of 129%, while Scatec (renewable energy) brings up the rear with a loss of 24%. In 2021, around 50 transactions (purchases and sales) were made.
Performance
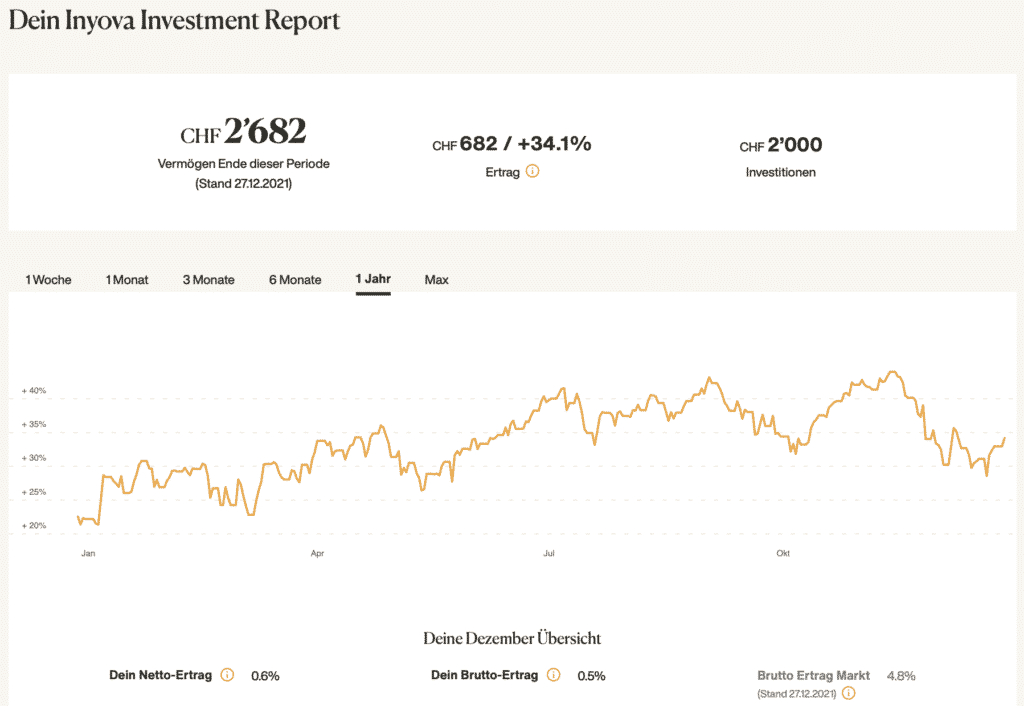
Since mid-November, the Inyova strategy has weakened somewhat. This was also the case for the overall market, but it was able to recover more quickly and lost less. It is a pity that no benchmark can be displayed in the graphic. The weakening is also reflected in the December overview. I would like to see such comparisons for more time periods.
Overall, the reporting function is only halfway satisfactory. You can select different time periods, but the graph will not start from zero. Example: If I select one year as the time period, the graph starts at 21.7% at the end of December 2020. But really, I want to see how the strategy has performed in this one year. Nowhere is this presented to me in numbers.
Selma
News and general
Selma brought Migros Group on board in a financing round in early 2021, launched an iOS app and completely revamped its website.
From a minimum of CHF 2’000 you can start with Selma. The fee starts at 0.68% and decreases to 0.47% as assets increase. In addition, the product costs, stamp taxes and exchange rate surcharges are charged. You can find more details in this post.
Portfolio
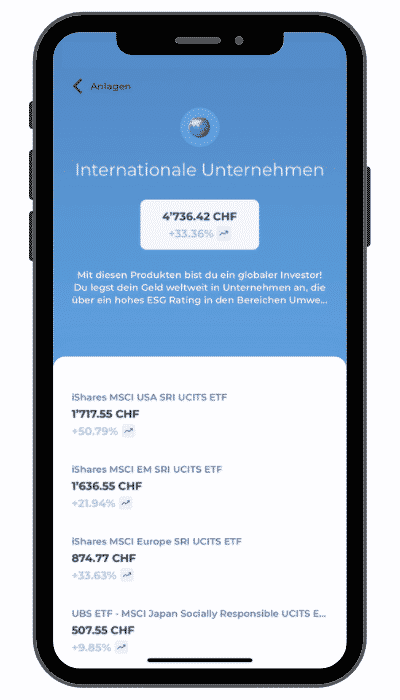
After the initial investment of CHF 2,000, I paid in CHF 50 every month in 2021 to map an ETF savings plan. Of course, this would also be possible with the other providers.
My sustainable portfolio at Selma is 15.3% precious metals and 14.2% corporate loans, with the remainder in equity ETFs.
Performance
The reporting function is a bit too simple. You can only see the performance of the portfolio, and if you pay in regularly, then the curve simply runs from the bottom left to the top right. Above the chart you will find the time-weighted return since the opening of the portfolio.
And for the individual ETFs, you can also view the money-weighted return.
But you can unfortunately forget about displaying the return for a certain period, for example for the year 2021.
True Wealth
News and general
Since November, the complete offering has additionally been available in French and the process for determining risk tolerance has been revised.
True Wealth’s investment solution is available from an investment amount of CHF 8,500. The annual all-in asset management fee is 0.50% and decreases to 0.25% as the volume increases. In addition, the product costs, stamp taxes and exchange rate surcharges are charged. You can find all the details in this post.
Portfolio
I only opened the account with True Wealth at the end of May 2021 and put together my own strategy. The strategy is explained in more detail in the book “The ETF Portfolio: How to Build and Manage an Almost Unbeatable Portfolio” in more detail. Since this is not a standard True Wealth strategy, I will not present or explain it further here.
Performance
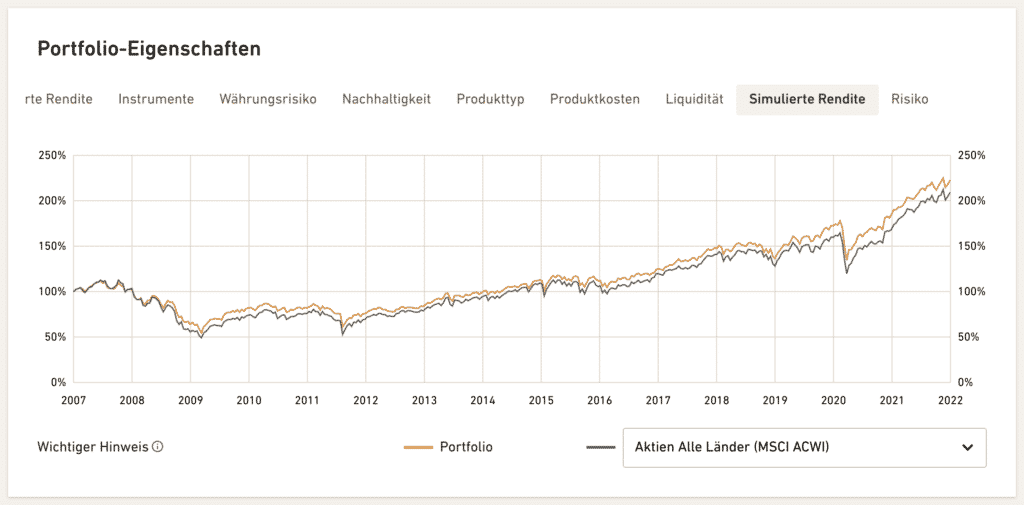
In a comparison of the four providers, True Wealth has by far the most sophisticated reporting. You can even select benchmarks and your own time periods.
Closing remarks Review of the year
With all four providers you can easily and conveniently implement a savings plan in Switzerland. Compared to a traditional bank with a fund savings plan, the costs are only about half as high.
Due to the very different reporting functions and the different strategies, the performance of the providers can hardly be compared with each other. Hopefully, most reporting features are so immature because vendors are still relatively young, not because they shy away from comparison.
Even though True Wealth offers the best reporting feature, this is not necessarily the best provider for you. Check out the websites, read the detailed reviews, and then decide which features are important to you personally.
Transparency and disclaimer
I was not paid by anyone for this blog post, it reflects my subjective opinion.
If you open accounts or business relationships, order products or services through my links and codes, I may receive a commission for doing so. However, you will not suffer any disadvantages such as higher prices or the like. The terms and conditions of the respective providers apply. Affiliate links are marked with a *.
Investments are associated with risks which, in the worst case, can lead to the loss of the capital invested.
All publications, i.e. reports, presentations, notices as well as contributions to blogs on this website (“Publications”) are for information purposes only and do not constitute a trading recommendation with regard to the purchase or sale of securities. The publications merely reflect my opinion. Despite careful research, I do not guarantee the accuracy, completeness and timeliness of the information contained in the publications.

