Letztes Update: 28. September 2023
We have already looked at some Swiss ETFs. But what about ETFs that diversify internationally and thus even more broadly? That’s exactly what this post is about.
Introducing the Vanguard FTSE All-World UCITS ETF. It is listed under ISIN IE00B3RBWM25 re. under the symbol VWRL and includes stocks from developed and emerging markets. A total of 3,430 different shares are included. With the purchase of a share, you therefore acquire a stake in 3,430 companies in one fell swoop.
The great thing is that it is listed on the Swiss stock exchange in Swiss francs. So you don’t have to make an extra currency exchange and therefore there are no exchange fees.
The total expense ratio amounts to a low 0.22%. A total of CHF 4,112 million is invested in this ETF. So it’s a really big and popular ETF. Accordingly, the probability that it will be closed is small.
It is physically replicating, so it actually buys the stocks included in the index.
The dividend yield is 2.9% and dividends are paid quarterly.
The tracking difference is also excellent: according to the website Trackingdifferences, the average annual deviation from the index performance (tracking difference) since 2013 was -0.04% per year. Thus, the ETF was more favorable for investors than the TER suggests and even outperformed the index.
How can this be possible? Either an ETF can lend its shares and receives a fee for doing so, or it performs better than the index through “optimized sampling.” In the case of an index that contains a large number of stocks, the ETF issuer may decide not to hold all the stocks, he just does a sampling.
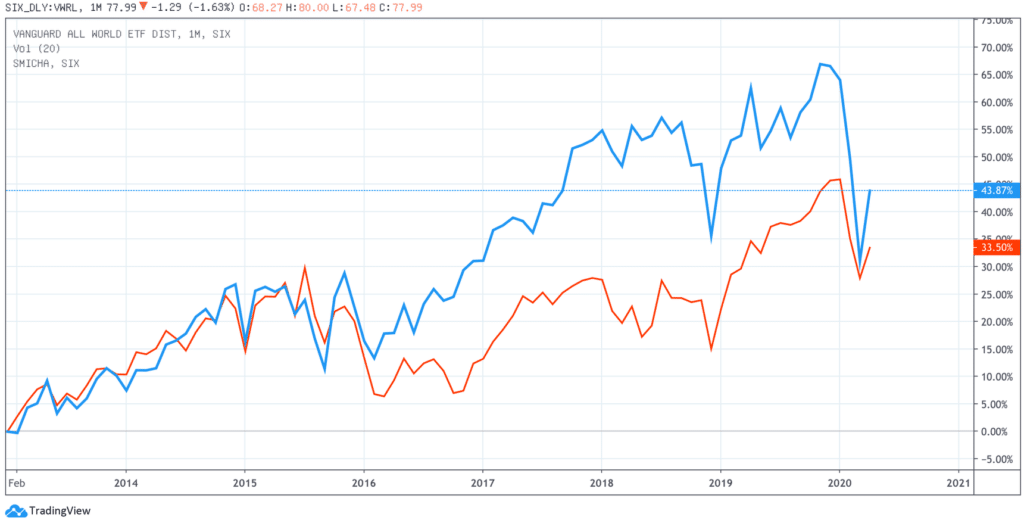
Below you can see the Vanguard FTSE All-World UCITS ETF (blue) compared to the UBS ETF (CH) SMI® ETF (red) over seven years. After all, the SMI tracks the 20 largest Swiss stocks.
The steep rise of the All-World ETF from 2016 comes mainly from the “FAANG stocks”. The following stocks are referred to as “FAANG stocks”: Facebook, Amazon, Apple, Netflixand Alphabet(Google’sparent company). As you will see in a moment, the technology sector is quite heavily weighted in it, which is not the case with the SMI.
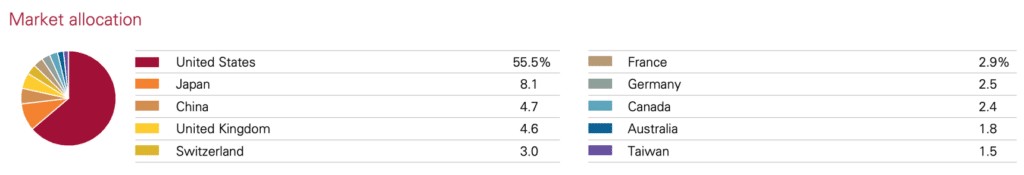
Countries
A total of 24 developed and 23 emerging markets are represented in the ETF. The share of emerging markets amounts to 10.4%.
The USA accounts for the largest share with 55.5%, followed by Japan with 8.1%, China with 4.7%, the United Kingdom with 4.6% and then already Switzerland with 3.0%.
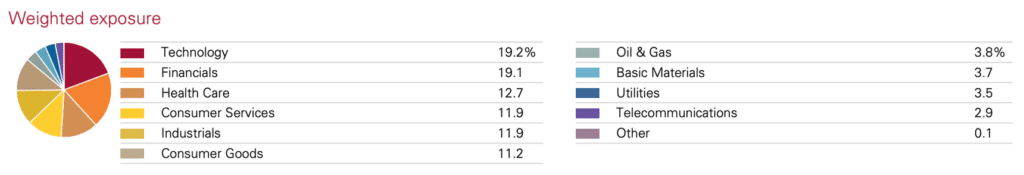
Sectors and shares
The technology sector dominates with 19.2%, followed by the financial sector with 19.1%. The telecommunications sector brought up the rear with 2.9%.
The three largest stocks are Microsoft Corp (2.9%), Apple Inc. (2.6%) and Amazon.com Inc. (2,0%). In ninth place comes a Swiss company with 0.7%. The company in question is Nestlé. The 10 largest positions account for a total of approximately 14.2%.
If one of the companies in it goes bankrupt, then it does not matter so much for you, since the weight of a single share in it does not correspond to more than 2.9%. If, on the other hand, you have a share of the company in your portfolio and it goes bankrupt, then you have to book a total loss.
But as you can see from the line chart of the All-World ETF above, even a world index can go down quite a bit. In the Corona crash, it lost over 20% in a few days. However, it then stabilized quite quickly and still has a loss of 14% from the November 2019 high at the beginning of May.
The ETF issuer
Vanguard was founded in 1975 in the USA by John C. Bogle and is organized as a cooperative. Bogle is also dubbed the “father of the index fund.” Assets under management worldwide amount to USD 6.20 trillion. This makes Vanguard the world’s second largest asset manager behind BlackRock (iShares is a BlackRock brand).
Alternatives
Of course, there are other providers for similar ETFs. But just the table below shows once again that Vanguard offers a very affordable and safe product.
The three ETFs below follow the index“MSCI ACWI“, this differs slightly from the “FTSE All-World”. For example, the ACWI contains about 1000 fewer companies than the All-World. The latter thus covers about 90% to 95% of the investable markets worldwide. However, this is hardly noticeable in the performance of the two; they run almost the same even over longer periods.
Incidentally, MSCI (Morgan Stanley Capital International) and FTSE (Financial Times Stock Exchange) are two different index providers.
The only criticism of the Vanguard FTSE All-World is that it is not available as an accumulating ETF. The dividends are therefore not automatically reinvested. It would be great if Vanguard offered both variants, then the customer could decide for himself which fits better to his strategy.
| Anbieter | ISIN | TER | Fondsgrösse (in Mio. CHF) | Ausschüttung | Replikationsmethode | Handelswährung an der Swiss Exchange |
| iShares | IE00B6R52259 | 0.20% | 5'115 | Thesaurierend | Optimiertes Sampling | USD und CHF |
| SPDR | IE00B44Z5B48 | 0.40% | 2'174 | Thesaurierend | Optimiertes Sampling | CHF |
| UBS | IE00BYM11H29 | 0.21% | 753 | Thesaurierend | Swap-basiert | USD |
The data is based on the sales prospectuses of the providers as of the end of June 2021.
Further information on the ETFs can be found directly at the ETF providers.
Related links
- On justETF you get your good overview of many ETFs tradable in the Swiss.
- Vanguard Switzerland website. By the way, the website of Vanguard Germany is much more designed for private investors, there you can also find everything about the ETF.
- Data sheet as PDF from FTSE Russel on the All-World Index.
Transparency and disclaimer
I was not paid by anyone for this blog post, it reflects my subjective opinion.
If you open accounts or business relationships, order products or services through my links and codes, I may receive a commission for doing so. However, you will not suffer any disadvantages such as higher prices or the like. The terms and conditions of the respective providers apply. Affiliate links are marked with a *.
Investments are associated with risks which, in the worst case, can lead to the loss of the capital invested.
All publications, i.e. reports, presentations, notices as well as contributions to blogs on this website (“Publications”) are for information purposes only and do not constitute a trading recommendation with regard to the purchase or sale of securities. The publications merely reflect my opinion. Despite careful research, I do not guarantee the accuracy, completeness and timeliness of the information contained in the publications.